I've been preparing for Christmas and, in a rush to grab some last-minute presents ASAP, I find my brain craving a distraction to offer some procrastination potential.
So... ┌( ಠ_ಠ)┘... I began probing the forum, attempting to decipher the correlation between Level and Message counts. Here is what I figured out, looking at some data points I collected:
 (I also believe that reactions do not contribute to level progression; instead, it seems that only comments/posts are significant in determining your forum level.)
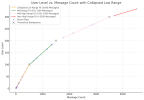
I started with Initial Linear Regression: a simple linear regression model to determine if there was a straightforward linear relationship between message counts and user levels. This provided me with an initial understanding but didn't accurately capture the nuances in the data. Putting it on a graph revealed a kind of curve. ╭( ๐ _๐)╮
After that I explored Non-Linear Models: Seeing that the linear model wasn't quite fitting, especially at higher message counts, I explored non-linear models, including quadratic, logarithmic, and exponential models. These models attempted to capture the curvature in the data but led to impractical implications, like decreasing levels with increasing messages. And it was honestly not likely that we would loose levels if we posted more than 3000 messages. Σ(-᷅_-᷄๑)
I introduced a Piecewise Linear Model: Considering a piecewise linear approach, dividing the data into segments based on observed changes in the rate of level progression, was the next step to go. This involved fitting separate linear regressions to different ranges of message counts, acknowledging that the rate of level increase varied across these ranges.
As more data points were provided, I refined the breakpoints and the number of segments in the piecewise model. This included adjusting the ranges of message counts for each segment and revisiting the linear regressions for each range. I identified specific message counts as potential breakpoints (500, 1500, 3500 messages) that seemed to mark the beginning of new ranges. These theoretical breakpoints corresponded to significant levels (100, 200, 300), suggesting a pattern in how levels might be assigned. (´-`). 。oO()
Now to my models for each range:
Level≈slope×Messages+intercept
TLDR;
What are you doing right now, instead of whatever you were supposed to do?
So... ┌( ಠ_ಠ)┘... I began probing the forum, attempting to decipher the correlation between Level and Message counts. Here is what I figured out, looking at some data points I collected:
 (I also believe that reactions do not contribute to level progression; instead, it seems that only comments/posts are significant in determining your forum level.)
I started with Initial Linear Regression: a simple linear regression model to determine if there was a straightforward linear relationship between message counts and user levels. This provided me with an initial understanding but didn't accurately capture the nuances in the data. Putting it on a graph revealed a kind of curve. ╭( ๐ _๐)╮
After that I explored Non-Linear Models: Seeing that the linear model wasn't quite fitting, especially at higher message counts, I explored non-linear models, including quadratic, logarithmic, and exponential models. These models attempted to capture the curvature in the data but led to impractical implications, like decreasing levels with increasing messages. And it was honestly not likely that we would loose levels if we posted more than 3000 messages. Σ(-᷅_-᷄๑)
I introduced a Piecewise Linear Model: Considering a piecewise linear approach, dividing the data into segments based on observed changes in the rate of level progression, was the next step to go. This involved fitting separate linear regressions to different ranges of message counts, acknowledging that the rate of level increase varied across these ranges.
As more data points were provided, I refined the breakpoints and the number of segments in the piecewise model. This included adjusting the ranges of message counts for each segment and revisiting the linear regressions for each range. I identified specific message counts as potential breakpoints (500, 1500, 3500 messages) that seemed to mark the beginning of new ranges. These theoretical breakpoints corresponded to significant levels (100, 200, 300), suggesting a pattern in how levels might be assigned. (´-`). 。oO()
Now to my models for each range:
Level≈slope×Messages+intercept
Collapsed Low Range (Messages ≤ 500) | Mid Range (501 ≤ Messages ≤ 1500) | Mid-High Range (1501 ≤ Messages ≤ 3500) | Very High Range (Messages > 3500) |
| Given the slope is close to 0.20 and the intercept is small and negative, we might simplify this to: Level=0.2 × Messages Here, the intercept is eliminated for simplicity, assuming the level starts from zero. | The slope is around 0.10, and the intercept is significant. A simple approximation might be: Level=0.1 × Messages +50 This assumes a round number for the intercept and retains the original slope. | With a slope around 0.05 and a larger intercept, a simpler version could be: Level=0.05 × Messages +125 This uses a rounded intercept and a simplified slope. | Two data points are just not enough to make any confident statement about the progression of this range. |
TLDR;
What are you doing right now, instead of whatever you were supposed to do?
Last edited:


